• 3848阅读
  • 8回复

QCustomPlot画曲线 [复制链接]

上一主题 下一主题
离线赵小七
 

只看楼主 倒序阅读 楼主  发表于: 2018-03-27
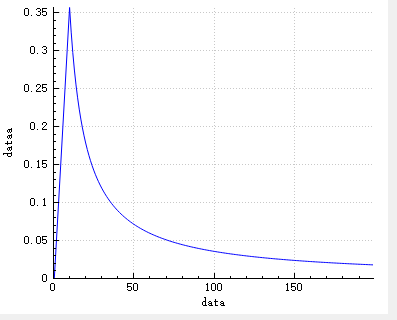
用QCustomPlot画曲线。写了一个for循环,从10到200,画出的曲线是从0开始的,如图。求大神如何解决.。。。怎么去掉左边的那条线


  QVector<double> x(10000), y(10000); // initialize with entries 0..100  
  
    for(double i=detectDistMin ; i < detectDistMax ; i++)
    {  
    x = i;
     y = (targetWidth * focus )/(picSizeWidth * i );
    }  

        ui.qCustomPlot->addGraph();
        ui.qCustomPlot->setInteractions(QCP::iRangeDrag | QCP::iRangeZoom);
        ui.qCustomPlot->graph(0)->setData(x, y);  
  
      ui.qCustomPlot->xAxis->setLabel("data");
      ui.qCustomPlot->yAxis->setLabel("dataa");  
  
     ui.qCustomPlot->rescaleAxes();
     ui.qCustomPlot->rescaleAxes();
         ui.qCustomPlot->replot();  

本帖提到的人: @liudianwu
离线zxwmail

只看该作者 1楼 发表于: 2018-03-31
detectDistMin ;detectDistMax的取值是什么
离线赵小七

只看该作者 2楼 发表于: 2018-03-31
回 zxwmail 的帖子
zxwmail:detectDistMin ;detectDistMax的取值是什么 (2018-03-31 10:51) 

从10 到90

我试了一下,for循环如果从0开始的话,图就是正常的,不从0开始,就会有那么一条线

求大神告知
离线赵小七

只看该作者 3楼 发表于: 2018-03-31
回 zxwmail 的帖子
zxwmail:detectDistMin ;detectDistMax的取值是什么 (2018-03-31 10:51) 

从10 到90

我试了一下,for循环如果从0开始的话,图就是正常的,不从0开始,就会有那么一条线

求大神告知
离线赵小七

只看该作者 4楼 发表于: 2018-03-31
回 赵小七 的帖子
赵小七:从10 到90
我试了一下,for循环如果从0开始的话,图就是正常的,不从0开始,就会有那么一条线
....... (2018-03-31 12:01) 

刚刚写错了,是从10到200
离线赵小七

只看该作者 5楼 发表于: 2018-03-31
回 赵小七 的帖子
赵小七:从10 到90
我试了一下,for循环如果从0开始的话,图就是正常的,不从0开始,就会有那么一条线
....... (2018-03-31 12:01) 

刚刚写错了,应该是从10到200
离线zxwmail

只看该作者 6楼 发表于: 2018-03-31
贴一下你的x,y值看看
离线赵小七

只看该作者 7楼 发表于: 2018-04-01
回 zxwmail 的帖子
   QVector<double> x(101),y(101);//分别存放x和y坐标的数据,101为数据长度    for(int i=0;i<101;i++)   {       x=i;     y=i+33;   }
  //向绘图区域QCustomPlot(从widget提升来的)添加一条曲线   ui->qCustomPlot->addGraph();    ui->qCustomPlot->setInteractions(QCP::iRangeDrag | QCP::iRangeZoom);   //添加数据   ui->qCustomPlot->graph(0)->setData(x,y);
  //设置坐标轴标签名称   ui->qCustomPlot->xAxis->setLabel("x");   ui->qCustomPlot->yAxis->setLabel("y");
   //设置坐标轴显示范围,否则我们只能看到默认的范围  // ui->qCustomPlot->xAxis->setRange(0,11);  //ui->qCustomPlot->yAxis->setRange(0,110);  ui->qCustomPlot->rescaleAxes(); ui->qCustomPlot->rescaleAxes();

for循环从0开始循环的话,结果如图,

for循环从1开始循环,结果如图。

不知道是啥原因,,求大神告知


离线赵小七

只看该作者 8楼 发表于: 2018-04-01
回 zxwmail 的帖子
zxwmail:
贴一下你的x,y值看看

   QVector<double> x(101),y(101);//分别存放x和y坐标的数据,101为数据长度

  for(int i=0;i<101;i++)
   {
      x=i;
     y=i+33;
   }

  //向绘图区域QCustomPlot(从widget提升来的)添加一条曲线
   ui->qCustomPlot->addGraph();
    ui->qCustomPlot->setInteractions(QCP::iRangeDrag | QCP::iRangeZoom);
   //添加数据
   ui->qCustomPlot->graph(0)->setData(x,y);

  //设置坐标轴标签名称
   ui->qCustomPlot->xAxis->setLabel("x");
   ui->qCustomPlot->yAxis->setLabel("y");

   //设置坐标轴显示范围,否则我们只能看到默认的范围
  // ui->qCustomPlot->xAxis->setRange(0,11);
  //ui->qCustomPlot->yAxis->setRange(0,110);
  ui->qCustomPlot->rescaleAxes();
ui->qCustomPlot->rescaleAxes();


for循环从0开始,结果是
[attachment=18677]


for循环从1开始,结果是


快速回复
限100 字节
 
上一个 下一个