


日志
QCustomplot 选择折线上的点并显示当前折线点的数值大小
2016-05-19 00:36
本帖子原创作者:清澈的眼神@xiaoniede。转载注明原创作者地址。欢迎大家一起讨论技术问题。学习交流QQ群:498278174
不多说直接上效果图: 图1:[attachment=15215] 图2: 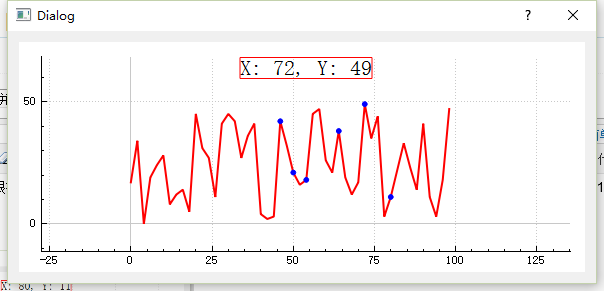 实现思路参考qt Charts下例子:scatterinteractions。 void Dialog::initCustomplot(){ ///鼠标点击的有效距离,越小越准确。 ui->customplot->setSelectionTolerance(5); ///设置用户交互 ui->customplot->setInteractions(QCP::iRangeDrag | QCP::iRangeZoom | QCP::iMultiSelect | QCP::iSelectOther | QCP::iSelectItems /*| QCP::iSelectPlottables*/ ); ///set X Axis ui->customplot->xAxis->setRange(0, 100); ///set Y Axis ui->customplot->yAxis->setRange(-50, 50); ui->customplot->yAxis->setAutoTickCount(2); ///设定自动显示的标签个数 ///设置自动步长,方便区间控制 ui->customplot->yAxis->setAutoTickStep(false); ui->customplot->yAxis->setTickStep(50.0); ///释放鼠标处理 connect(ui->customplot, SIGNAL(mouseRelease(QMouseEvent*)), this, SLOT(slot_mouseRelese(QMouseEvent*))); ///添加文本标签 m_pMousValue = new QCPItemText(ui->customplot); ui->customplot->addItem(m_pMousValue); m_pMousValue->setPositionAlignment(Qt::AlignTop|Qt::AlignHCenter); m_pMousValue->position->setType(QCPItemPosition::ptAxisRectRatio); m_pMousValue->position->setCoords(0.5, 0); // place position at center/top of axis rect m_pMousValue->setText("Text Item Value"); m_pMousValue->setFont(QFont(font().family(), 16)); // make font a bit larger m_pMousValue->setPen(QPen(Qt::red)); // show black border around text ///具体思路如下:两条折线图,一条实线的折线图,一条散点的折线图 ui->customplot->addGraph(); ui->customplot->graph(0)->setPen(QPen(Qt::red, 2)); ui->customplot->graph(0)->setSelectedPen(QPen(Qt::blue, 2)); ui->customplot->graph(0)->setLineStyle(QCPGraph::lsLine); ///步骤2 新建一条散点图 QCPScatterStyle myScatter; myScatter.setShape(QCPScatterStyle::ssDisc); myScatter.setPen(QPen(Qt::blue)); myScatter.setBrush(QBrush(Qt::white)); myScatter.setSize(5); ui->customplot->addGraph(); ui->customplot->graph(1)->setLineStyle(QCPGraph::lsNone); ui->customplot->graph(1)->setScatterStyle(myScatter); QVector<double> dVctValue; QVector<double> dVctKeys; int dequlNum = qrand()%10*50; if(dequlNum == 0){ dequlNum = 50; } int n = 50; for(int i = 0; i < n; i++) { dVctValue.append(qrand()%dequlNum); dVctKeys.append(i*2); } ui->customplot->graph(0)->clearData(); ui->customplot->graph(0)->addData(dVctKeys, dVctValue); ui->customplot->graph(0)->rescaleValueAxis(); } void Dialog::slot_mouseRelese(QMouseEvent *event){ ///排除非左鼠标键 if (event->button() != Qt::LeftButton){ return; } QPointF ChickedPoint = event->posF(); ///排除区间外鼠标点 if(!ui->customplot->viewport().contains(event->pos())){ return; } QPointF closest(INT_MAX, INT_MAX); qreal distance(INT_MAX); QCPDataMap* m_graphDataMap1 = ui->customplot->graph(0)->data(); QCPDataMapIterator itr(*m_graphDataMap1); while(itr.hasNext()){ itr.next(); qreal dPosX = ui->customplot->xAxis->coordToPixel(itr.key()); qreal dPosY = ui->customplot->yAxis->coordToPixel(itr.value().value); QPointF currentPoint(dPosX, dPosY); qreal currentDistance = qSqrt((currentPoint.x()-ChickedPoint.x()) * (currentPoint.x()-ChickedPoint.x()) + (currentPoint.y()-ChickedPoint.y()) * (currentPoint.y()-ChickedPoint.y())); if(currentDistance < distance){ distance = currentDistance; closest = currentPoint; } } ///可放开调试信息,观察鼠标点击到折线的距离。 ///qDebug()<<"------pos-------"<<distance; if(distance > ui->customplot->selectionTolerance()){ return; } double dKey = ui->customplot->xAxis->pixelToCoord(closest.x()); double dValue = ui->customplot->yAxis->pixelToCoord(closest.y()); ///添加到散点折线图中 ui->customplot->graph(1)->removeData(dKey); ui->customplot->graph(1)->addData(dKey, dValue); m_pMousValue->setText(QString("X: %1, Y: %2").arg(dKey).arg(dValue)); } 本帖子原创作者:清澈的眼神@xiaoniede。转载注明原创作者地址。欢迎大家一起讨论技术问题。学习交流QQ群:498278174 |
下一篇: 2016.12.23 日志
上一篇: 无

-
删除
zhuifengwy:很不错,是否考虑把标尺也加上,就像股票软件中的 十字游标一样
2016-06-14 20:25 -
t1029901995:有没有详细的解释呢???
2016-06-21 22:15